
Computer Aided Urban Planning
 |
 |
 |
 |
|||||
Session:10,001 General Plan Maps (March 13, 8:45am)
|
|||||||||||||||||||||||||||
|
Computer Aided Urban Planning
|
|
||||||||||||||||||||||||||
Session:10,001 General Plan Maps (March 13, 8:45am) |
|||||||||||||||||||||||||||
|
ABSTRACT: Utah has a long history of urban planning. Current high rates of growth have put pressure on local governments to plan better. A new approach to future land use and transportation planning for high-growth cities is presented. The approach employs a genetic algorithm to efficiently search through hundreds of thousands of possible future plans, instead of the usual four or five plans in conventional planning practice. The best plans that meet certain criteria are put together in a Pareto set. This set may be placed before decision makers. A Pareto set scanner also is described that assists decision makers in shopping through the Pareto set to select a plan. Some of the differences between simultaneous planning and separate planning of highly coupled twin cities are also examined.
|
| Land Use |
|
(Homes/km2) |
| FARM | Farm Land |
|
| VLDRm | Very Low Density Residential - Medium income |
|
| VLDRh | Very Low Density Residential - High income |
|
| LDRl | Low Density Residential - Low income |
|
| LDRm | Low Density Residential - Medium income |
|
| LDRh | Low Density Residential - High income |
|
| MDRl | Medium Density Residential - Low income |
|
| MDRm | Medium Density Residential - Medium income |
|
| MDRh | Medium Density Residential - High income |
|
| HDRl | High Density Residential - Low income |
|
| HDRm | High Density Residential - Medium income |
|
| HDRh | High Density Residential - High income |
|
| CBD | Central Business District | |
| SC | Shopping Center | |
| GC | General Commercial | |
| LI | Light Industrial | |
| HI | Heavy Industrial |
----
| Corridor |
|
(km/hr) |
(veh/hr) |
| C0 | Unused | ||
| C2 | 2-lane collector |
|
|
| C3 | 3-lane collector |
|
|
| A2 | 2-lane arterial |
|
|
| A3 | 3-lane arterial |
|
|
| C4 | 4-lane collector |
|
|
| C5 | 5-lane collector |
|
|
| A5 | 5-lane arterial |
|
|
| C7 | 7-lane collector |
|
|
| A6 | 6-lane arterial |
|
|
------
The current populations of Provo and Orem are, respectively, 107,000 and 76,000, giving a combined city population of 183,000. By the year 2020, the combined population is expected to increase to 352,000. We Imposed four housing constraints on the future plans:
- Low-income housing capacity: 87,000 people;
- Medium-income housing capacity: 134,000 people;
- High-income housing capacity: 114,000 people; and
- Total housing capacity: 352,000 people.
The housing population capacity is based on density multiplied by the current Provo/Orem average of 3.68 people per household. Income levels where roughly based on density, i.e. no low income in the very low density zone. However, some high income, high density housing was allowed such as condominiums along the golf course. The housing data was verified against census data. Interestingly, according to census data, the most affordable housing, based on the occupants' income, was very low density, while the least affordable was high density.
A plan that does not satisfy all of the housing constraints is labeled an "infeasible" plan. The status quo zoning plan for the cities of Provo and Orem is infeasible. The total housing capacity in the status quo plan is only 289,664, which is far less than the projected population of 352,000.
Three objectives where considered. The first objective was to minimize traffic congestion. A traffic model was developed using the 199 zones as traffic analysis zones (TAZ). The MINUTP software package was used to assign daily trips between zones on the corridors and other existing streets (4). The first objective was quantified as the minimization of the total travel time of all trips in a 24 hour period. Evaluation of this objective for a single plan on a 200-MHz Pentium processor required about 105 seconds.
The second objective was to minimize costs and maximize revenues. Only those costs and revenues that change as the zones and corridors change were considered. Costs and revenues that depend only on the total population of the combined cities were neglected since the projected future population is the same for all plans. The considered costs included the construction costs and right-of-way purchase costs of corridor upgrades. The considered revenues included the property and sales tax revenues. It is likely that the considered revenues will exceed the considered costs, so the value of this objective function usually is negative.
The third objective was to minimize change from the status quo. This objective was added in an attempt to ensure that future plans are politically feasible. The objective was quantified in terms of money. The change function was calculated as the sum over the zones of the product of the area, the property value, and the degree-of-change factor plus the sum over the corridors of the product of the area of a 60 meter wide strip on each side, the property value, and the degree-of-change factor. Both the change and cost-minus-revenue objective functions can be evaluated much more rapidly than the travel-time objective.
|
|
FARM |
|
|
|
|
|
|
|
|
|
|
|
|
|
|
|
|
|
|
|
|
|
|
|
|
|
|
|
|
|
|
|
|
|
|
|
|
|
|
|
|
|
|
|
|
|
|
|
|
|
|
|
|
|
|
|
|
|
|
|
|
|
|
|
|
|
|
|
|
|
|
|
|
|
|
|
|
|
|
|
|
|
|
|
|
|
|
|
|
|
|
|
|
|
|
|
|
|
|
|
|
|
|
|
|
|
|
|
|
|
|
|
|
|
|
|
|
|
|
|
|
|
|
|
|
|
|
|
|
|
|
|
|
|
|
|
|
|
|
|
|
|
|
|
|
|
|
|
|
|
|
|
|
|
|
|
|
|
|
|
|
|
|
|
|
|
|
|
|
|
|
|
|
|
|
|
|
|
|
|
|
|
|
|
|
|
|
|
|
|
|
|
|
|
|
|
|
|
|
|
|
|
|
|
|
|
|
|
|
|
|
|
|
|
|
|
|
|
|
|
|
|
|
|
|
|
|
|
|
|
|
|
|
|
|
|
|
|
|
|
|
|
|
|
|
|
|
|
|
|
|
|
|
|
|
|
|
|
|
|
|
|
|
|
|
|
|
|
|
|
|
|
|
|
|
|
|
|
|
|
|
|
|
|
|
|
|
|
|
|
|
|
|
|
|
|
|
|
|
|
|
|
|
|
|
|
|
|
|
|
|
|
|
|
|
|
|
|
|
|
|
|
|
|
|
|
|
|
|
|
|
|
|
|
|
|
|
|
|
|
The genetic algorithm begins with a starting generation of plans and creates generation after generation until a specified number of generations is reached. We chose the size of each generation to be 100 feasible plans. Since the housing constraints can be evaluated orders of magnitude faster than the travel-time objective, we decided to evaluate the objectives only of feasible plans. Thus, infeasible plans were "aborted" before the objectives were evaluated.
Each plan in the starting generation was obtained by randomly changing the land use from the status quo land use in up to 30 percent of the zones, and randomly upgrading the street type from the status quo type in up to 50 percent of the corridors. It was decided not to randomly change 100 percent of the zones and corridors from the status quo in order to limit the amount of change in the starting generation. The random changes in land use were biased toward the residential land use in order to more quickly find feasible plans. Nevertheless, 393,309 infeasible plans were aborted during the process of finding 100 feasible plans for the starting generation.
The following process was used to create a succeeding generation from the current generation:
In the second step listed above, the 10 elite plans that are copied without modification from the current generation to the succeeding generation consist of the three plans with the lowest values of the objectives taken individually, the three plans with the lowest averages of pairs of the objectives, the plan with the lowest average of all three objectives, and the three most-fit plans.
In the third step, the selection-crossover-mutation-abortion process follows a standard genetic algorithm procedure (5). In the selection phase, a father and a mother plan are randomly selected from the current generation (see figure 1 [crossover.gif]). The probability of selection is proportional to the fitness of the plan. On average, 19.5 plans were aborted in order to obtain 90 feasible plans for each generation.
We executed our genetic algorithm for 100 generations. Thus, our search consisted of 10,000 feasible designs. Since it required 105 seconds to evaluate the travel-time objective for each feasible design, our genetic algorithm ran for 12 days on a 200-MHz Pentium processor. During the course of execution, 395,235 additional infeasible plans were aborted.
The lowest travel time among plans in the starting generation was 275,955 vehicle hours per day (see figure 2 [ProvoOrem.gif]). The lowest travel time among plans in the final generation was 204,808 vehicle hours per day for a reduction of 26 percent. The generation minimum of the change objective was reduced from $612,732 X 10,000 in the starting generation to $412,534 X 10,000 in the final generation for a reduction of 33 percent. The generation minimum of the cost-minus-revenue objective was reduced from -$25,917 per capita per year in the starting generation to -$45,342 per capita per year in the final generation for a reduction of 75 percent.
The amount of data contained in the global set of plans may be overwhelming for decision makers. We developed an interactive software tool that allows decision makers to graphically explore the global set. The tool displays a map of the combined cities for a particular plan on the computer screen. Land uses for each zone are indicated by color and street types are indicated by line width. Numeric values of the three objectives and the total housing capacity for the particular plan being displayed also appear on the screen. The tool has a slider bar for each of the three objectives. The user can use the mouse to move the slider bar for each objective to any position between 0 and 1. The positions of these slider bars indicate the relative importance of the objectives. A relative importance of 1 for a particular objective is maximum, and a relative importance of 0 is minimum.
The plan whose map and numerical data are displayed on the screen is the plan whose coordinates in scaled objective space are closest in the Euclidean sense to the slider-bar point.
All of this occurs in real time. Thus, as the slider bar is moved back and forth, the map and numerical data displayed on the screen change from plan to plan. It is possible to do this in real time because all of the computations where preformed for each plan during the execution of the genetic algorithm.
This tool allows decision makers to observe trends as they interactively shift the relative importances of the objectives. They may observe that the plan of some parts of the city may be insensitive to the relative importance placed on some objectives and very sensitive to the relative importance placed on other objectives. Ultimately, this can help them make a better decision and select a final plan.
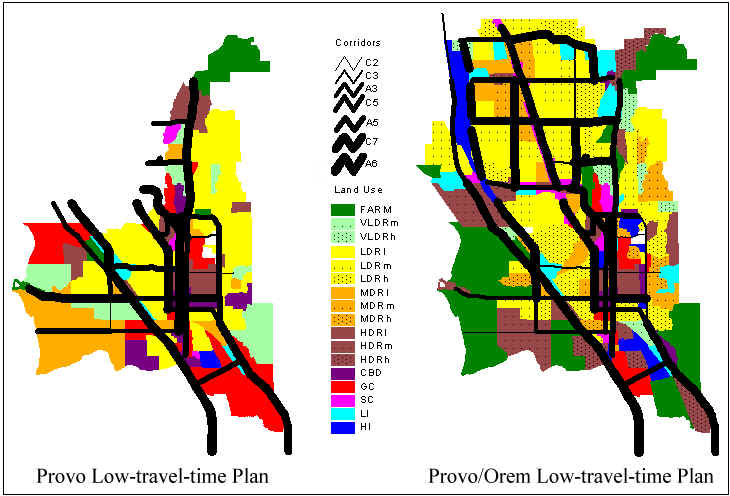
In our approach, we developed future plans for the twin cities of Provo and Orem together (see figure 3 [complowtimes.jpg]). We call this approach simultaneous planning. Alternatively, we could have applied the approach to the city of Provo and then applied it to the city of Orem. We call this approach separate planning. With respect to land use, it is evident that simultaneous planning promotes cooperation between the cities. The future plan shifts the majority of high-density residential land to Provo and the majority of commercial land to Orem. In separate planning, Provo must maintain a balance of land use within its own boundaries. Thus there is less high-density land use and more commercial land use in Provo than with simultaneous planning. And interesting result of this cooperation is theat more status quo farmland in Provo is able to remain farmland with simultaneous planning than with separate planning.
Regarding corridor upgrades, one obvious difference between simultaneous and separate planning is that simultaneous planning prescribes much greater capacities for the east-west corridors connecting the two cities. Clearly this idea benefits both cities, and it cannot be discovered with separate planning.
In this paper we have tried to explain some of the historical background related to planning in Utah. We have also discussed the lack of regional planning within the urban area of Provo/Orem. We have tried to provide a new approach to planning using a genetic algorithm to search through hundreds of thousands of possible future plans. This approach addresses two of the major difficulties with this problem: (a) the many land use and transportation options, and (b) the existence of multiple competing objectives. A plan scanner was also developed to help decision makers shop through the set to select a plan.
We also discussed some of the differences between simultaneous planning and separate planning of highly coupled twin cities.
Visit the Project Web Page at: http://research.et.byu.edu/growth/
REFERENCES
1. Planning and Zoning Administration in Utah, 3rd Edition, Center for Public Policy and Administration, University of Utah, 1994, pp. 1-8-1-9. [back]
2. Hwang, C. L., and A.S.M. Maud. Multiple Objective Decision Making-Methods and Applications: A State-of-the-Art Survey. Lecture notes in Economics and Mathematical Systems No. 164. Springer-Verlag, Berlin, 1979. [back]
3. Balling, R.J., J.T. Taber, M.R. Brown, and K. Day. Multiobjective Urban Planning Using a Genetic Algorithm. ASCE Journal of Urban Planning and Development, Vol. 125, No. 2, June 1999, pp. 86-99. [back]
4. MINUTP User's Manual. COMSIS Corp., Silver Spring, MD., 1996. [back]
5. Goldberg, D.E. Genetic Algorithms in Search, Optimization, and Machine Learning. Addison-Wesley, Reading, Mass., 1989. [back]
Copyright 2001 by Author
Andrew K. Jackson, AICP
ajackson@mountainland.org
586 East 800 North
Orem, Utah 84097
(801) 229-3836