
The Canadian city of Kamloops, British Columbia is typical of communities trying to gauge the benefits claimed for New Urbanism. With a high quality environment and robust economy, Kamloops' current population of 75,000 is expected to grow as much as 60% over the next 20 years, and citizens are anxious to know how to accommodate this growth without degrading community livability. To help sort through the rhetoric of New Urbanism, Kamloops decided to use an indicators approach that adapted the municipality's geographic information system (GIS) to measure the physical conditions advocated by New Urbanists. Using INDEX software for community indicators, stakeholders linked customized measurements of the built environment to the City's GIS database to test alternative land-use plans and neighborhood designs for New Urbanism qualities. The major objectives of this approach included:
As part of a municipal land-use plan update, the project team selected 30 indicators to be measured by the software. Most of these were derived from New Urbanism principles, but several also focused on parallel local concerns about energy efficiency and pollution prevention. The project's implementation strategy is to build initial public familiarity and support for this set of physically-oriented indicators, and to then follow over time with system expansion into related social, economic, environmental indicators.
As customized for Kamloops, the system will be applied at two levels: citywide and individual neighborhoods. At the citywide level, indicators measure the effects of broad "macro" land-use alternatives and establish benchmarks for gauging long-term citywide progress. The same functions can be performed at the neighborhood level, but at a much finer grain of "micro" measurement. Figures 1 and 2 describe a sampling of the system's first application in the Upper Sahali neighborhood, an area on the suburban fringe of Kamloops already developing in a low-density, auto-oriented pattern as represented by the "conventional" design. Using INDEX, the project team was able to quickly test several alternative New Urbanism or neotraditional designs to gauge improvements over the conventional case.
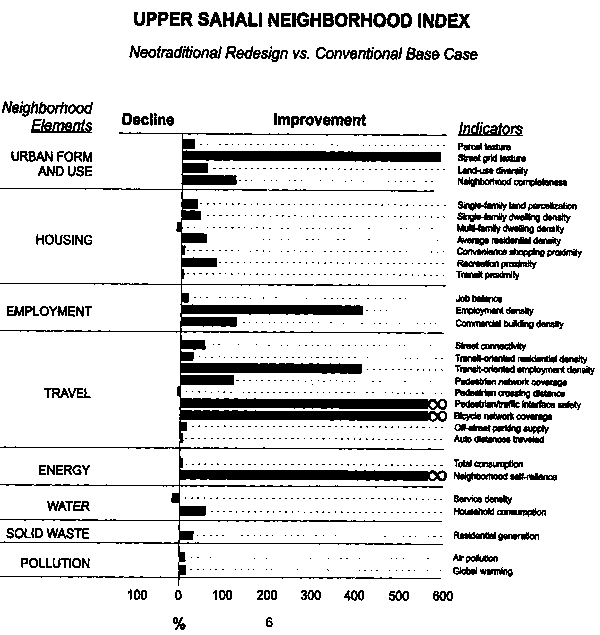
| Element | Indicator | Definition | Base Case Design | New Urbanism Design | % Change | Change Direction |
| Urban form And Use | Parcel texture | Average size of all parcels in sq.m. | 875 | 652 | -25 | + |
| Street grid texture | Ratio of blocks per hectare versus an ideal of one block per 0.5 hsctare. | 0.13 | 0.88 | 577 | + | |
| Land-uss diversity | Number of land-uses. | 6 | 10 | 67 | + | |
| Neighborhood completeness | Percent of key services present. | 38 | 85 | 124 | + | |
| Housing | Single family land parcelization | Average size of single family residential parcels in sq.m. | 692 | 477 | -31 | + |
| Single family dwelling density | Dwelling units per net hectare of land designated tor single-family use. | 14.5 | 21.0 | 45 | + | |
| Mufti-family dwelling density | Dwelling units per net hectars of land designated for multi-farnily use. | 50.6 | 46.3 | -10 | - | |
| Average residential density | Dwelling units per net hectare of at land designated for al! Residential uses. | 16.6 | 26 | 57 | + | |
| Convenience shopping proximity | Percent of dwellings within 400 m. of a convenience market. | 58 | 60 | 3 | + | |
| Recreation proximity | Percent of dwellings within 400 m. Of a school yard or park. | 28 | 49 | 77 | + | |
| Transit proximity | Percent of dwellings within 400 m. of a transit stop. | 96 | 97 | 1 | + | |
| Employment | Job balance | Ratio of jobs versus dwelling units. | 0.03 | 0.04 | 17 | + < |
| Employment density | Employees per net hectare of land designated for employment uses. | 6.9 | 35 | 407 | + | |
| Commercial building density | Average non-residential building floor area ratio. | 0.40 | 0. 90 | 125 | + | |
| Travel | Street connectivity | Ratio of street intersections versus intersections and cul-de-sacs. | .53 | 0.84 | 58 | + |
| Transit-oriented residential density | Average number of dwellings within 400 m. of transit stops. | 17.2 | 27.8 | 26.8 | + | |
| Transit-oriented employment density | Average number of employees within 400 m. of transit stops. | 6.9 | 35 | 407 | + | |
| Pedestrian network coverage | Percent of total street frontage with sidewalks | 45 | 100 | 122 | + | |
| Pedestrian crossing distance | Average street width curb-to-curb in m. | 9.9 | 10.5 | 6 | - | |
| Pedestrian/traffic Interface safety | Percent of Intersections equipped with calming devices or signals | 0 | 18 | + | ||
| Bicycle network coverage | Kilometers of designated bicycle routes divided by total neighborhood hectares. | 0 | 0. 02 | + | ||
| Residential off-street parking supply | Average number of off-street parking spaces per dwelling unit. | 1.9 | 1.6 | -16 | + | |
| Auto distances traveled | Average daily personal vehicle kilometers traveled per resident | 44.4 | 42.3 | -5 | + | |
| Energy | Total consumption | Energy consumed by residents for all purposes in GJ per resident per year. | 110 | 104 | -5 | + |
| Neighborhood self-reliance | Percent of energy produced in neighborhood vs. total building demands. | 0 | 8.5 | -5 | + | |
| Water | Service density | Total persons served per meter of water lines | 4.2 | 3.4 | -19 | - |
| Household consumption | Wafer consumed tar residential purposes in liters per resident per day. | 505 | 181 | -64 | + | |
| Solid Waste | Residential generation | Solid waste generated residentially in kg per resident per day. | 1.4 | 1.0 | -29 | + |
| Pollution | Air Pollution | Carbon monoxide emitted from all sources in kg per resident per year. | 76 | 67 | -12 | + |
| Global Warming | Carbon dioxide emitted from all sources in kg per resident per year. | 7806 | 6788 | -13 | + |
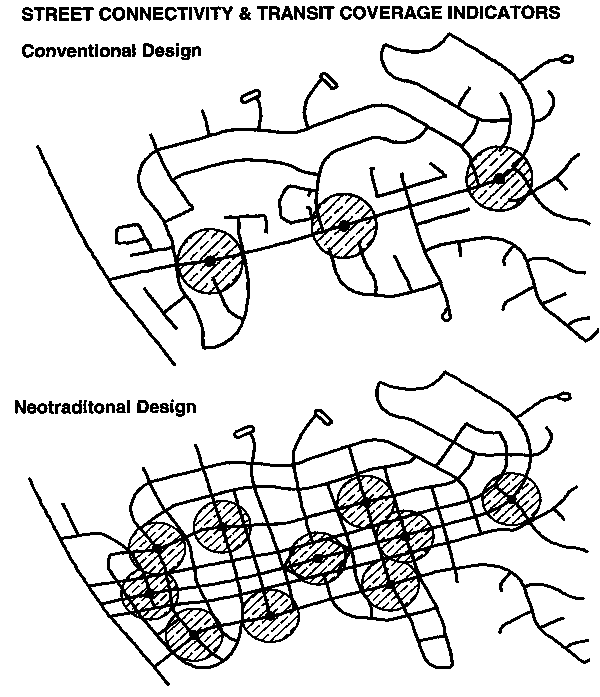
Figure 3 shows how the system can identify both strength and weaknesses in a given scenario. In the neotraditional case, planners successfully lowered multi-family dwelling density to accommodate neighbor concerns about too many apartments, but were still able to achieve a transit-friendly net increase in overall residential density through smaller single-family parcels. Alternatively, the model revealed that a desired increase in street grid texture may be too much of a good thing since increased street footages make water service density and pedestrian crossing distance indicators decline slightly. With this type of feedback, stakeholders are equipped to efficiently iterate to a final design. Once a neighborhood's plan is finalized, it can be remeasured at the citywide level to evaluate the cumulative effect on the community's overall benchmarks.
In terms of project outcomes, the Kamloops planners have now used the indicator system to help select a preferred citywide 2010 land-use scenario that is measurably more resource-efficient and sustainable than the previous plan. At the neighborhood level, indicators are being used to develop spatial and performance standards for mixed-use centers at strategic nodal locations on the local transit system. Perhaps most importantly, Kamloops has incorporated indicators into its official development review process. The durability of this approach is expected to encourage more livable proposals for community growth, and to provide quantifiable assurances to citizens that incremental progress is actually being made toward long-range goals.
Criterion Planners/Engineers
Portland, OR