
|
|
|||
|
Visualizations for Noise Management |
||
| David T. Dubbink | |||
| Session: 04/17/2000 8:45 AM | Author Info | ||
Resolving community noise problems demands an effective means of communicating complex technical information to decision makers. The Interactive Sound Information System (ISIS) is a tool designed to help communities understand and resolve noise management problems. Visualizations are a central feature of the package accompanied by actual noise examples. One of the unique capabilities of computer generated graphics is that wholly imaginary scenes can be made visible. With the ISIS package you can see noise-or at least graphic representations of it. The program makes use of the VRML 3D viewing technology with links to standard noise prediction models.
THE CHALLENGE
Urban places are noisy. The catalog of annoying noise sources is endless: over-flying jets, barking dogs, blaring music, dropped trash cans, muffler-less cars.... Noise interrupts our activities, robs us of our sleep, and may even cause physiological damage. But noise is more than an annoyance. It can become a deciding factor in planning decisions that impact the regional economy. The controversies that have erupted over reuse of military airfields are examples (e.g. El Torro NAS, Orange County; Homestead AFB, Miami area).
One of the special problems in dealing with community noise management issues is that it is difficult to explain noise impacts in terms most people, including decision-makers, readily understand. Explanations are difficult for several reasons. There are problems with both the physics of noise transmission and the complexity of the metrics used to describe it. It is difficult to accurately imagine how noise changes with distance. Noise energy decreases geometrically with distance and this is different than the way we see things with the size of objects diminishing proportionately with distance. Moreover, the decibel, the basic unit of noise measurement, is a logarithmic unit-adding a unique math to noise calculations. Multiple metrics are employed to describe the loudness, duration, and tonality of sounds. To top things off, community noise studies make use of combining metrics to characterize noise environments.
Citizens impacted by noise rarely have the patience to sit through a short course in sound control engineering. They just want to know what the proposed project is going to sound like and what the planners intend to do about it. The decision makers want a way of sorting through action alternatives that they and their constituencies understand. Even planners retreat a bit from the complexities of noise studies.
THE INTERACTIVE SOUND INFORMATION SYSTEM
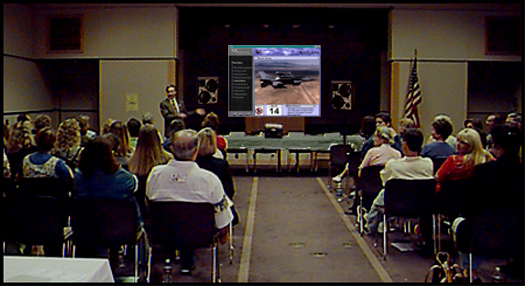
The Interactive Sound Information System (ISIS) is an established computer based package for presenting information about noise in the environment. The current release is based on technology that has been under development since 1988. The package was designed as a presentation tool for addressing noise issues in a format that can be understood by citizens and by decision makers with no special technical knowledge of noise management strategies (Figure 1).
 Figure
1
Figure
1
Central to the ISIS package is the idea that "real" noise examples, shaped to reflect local situations, are the best way to build an understanding of noise management issues. The reason that these real noise examples are so useful is that they are more direct and easy to understand than the written reports describing noise impacts using descriptive metrics. The interactive nature of the programming also makes it possible to test out, "What if?" situations and to respond to specific questions. The technology has been applied to many different types of environmental noise problems but it has been particularly useful in addressing airport noise issues.
The Federal Aviation Administration and the US Air Force assisted in development of a major upgrade of the original package. The upgraded version, like earlier versions, makes use of real noises, recorded digitally and played at precisely controlled volume levels. This enables people to listen to sounds such as aircraft flyovers at different locations, or move from outdoors to indoors and evaluate the effectiveness of various noise mitigation strategies.
Visual representations are critical in understanding noise impact situations. It's something like the difference between television and radio. The addition of visual information increases understanding and makes it possible for listener/viewers to more easily interpret and imagine the acoustic setting. Computer graphics become particularly useful when these settings represent future or changed conditions. The same advantages that computer graphics bring to architectural visualizations apply to the acoustic realm.
PROGRAM FEATURES
The complete program has more than twenty separate interactive sequences. There are sections that describe the nature of sound, its measurement, and the features of noise management programs. The training component builds from the basics to a demonstration of how individual sound events are accumulated into 24 hour measurements such as DNL. (The FAA was interested in promoting community understanding of this complex but useful metric).
There had been a problem with earlier versions of ISIS in that without 3D visualizations it was difficult to convey the dynamic, three-dimensional nature of flight operations. Listeners needed a reference space. They wanted to know, "Where am I?" and maps did not seem to convey this very well.
Our first response to the problem was to add videos of planes flying overhead. Videos made things more interesting but they didn't resolve the "Where am I?" issue. People were even distracted by visual details such as backgrounds and plane markings that didn't fit their experience (imagine showing a North Dakota audience a video with palm trees and an AeroMexico jet). The videos were also expensive in terms of file size requirements since we were including high quality sound and needed to show arrivals and departures for every significant aircraft in the commercial and military fleet.
We turned to Virtual Reality Modeling Language (VRML) technology as an alternative. In VRML a text file is used to describe all the geometric elements of a setting and the computer renders the scene in real time. In initial appearance the animations resemble an ordinary video animation. The difference is that the animations are not being generated by showing a rapid progression of separate images as in a movie, but by having the computer generate the scene and shift objects and viewer positions to produce the movements. Images are based on three-dimensional models which describe all of the geometry in a scene. The computer renders the prescribed movements of the geometry so quickly that the effect is the same as with a movie. 2D graphics can be applied to the surfaces of the models to color and texture them. In this way we attach airplane markings to the airplane models and paste an aerial photograph onto the ground surface. Smooth animations demand a fast computer with a good graphics card.
One benefit of this approach is that it consumes far less storage space than a movie style video clip. The 3D environment is described as a collection of points, and the viewer location and direction of sight are defined in the same way. These are text files. Motion can also be described as a sequence of changes in object and viewpoint locations. A movie that might have consumed 12 megabytes of storage space can be replicated in an instructional set of less than a megabyte. Implementing this type of animation on a notebook requires use of simple scenes without great detail. But people don't object to the obviously synthetic images that result and this relieved us of the problems that came with more literal depictions.
We quickly realized we could use the same technology to create graphic depictions of noise features that normally can't be seen. We could show such things as 24 hour noise accumulations, the shock waves radiating from sonic booms, and flight operations from yet-to-be-built runways. These excerpts from the larger program are described below.
24-HOUR NOISE ACCUMULATIONS
The FAA has experienced difficulties in explaining the DNL or "Day Night Level" metric. This metric represents average daily noise exposure and is a regular feature of community noise studies. People can readily understand how the loudness of single noise events is measured but when events get averaged into 24-hour noise energy doses, the explanation becomes more problematic. The normal way of representing DNL levels is though contour line plots-which adds an extra level of complexity.
We decided to show the noise accumulation building up around the noise source (Figure 2). An aerial photo is used as a base map. The animation shows the noise accumulation rising as a mountain, with color bands depicting lines of equal elevation.
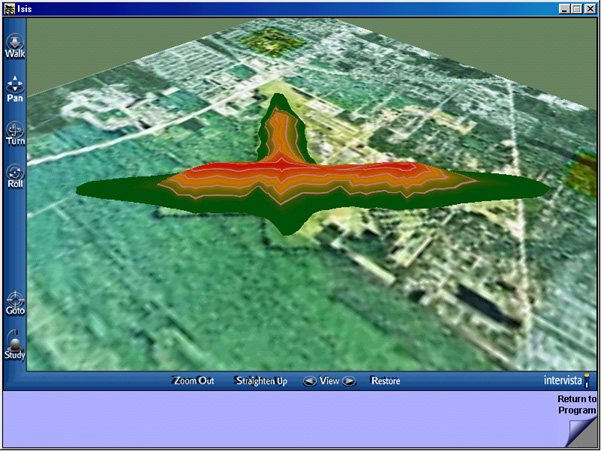 Figure 2
The VRML animation is accomplished by having the mountain underneath the ground plane and pushing it up through the surface into visibility (Figure3). Using preset VRML "camera positions" we can tilt the noise accumulation for an oblique view where we see its 3D nature. Then we can lift the viewpoint to a straight down angle and see the radiating whorls that are characteristic of a DNL contour map. An animation such as this is invaluable in explaining exactly what is being represented by the standard 2D mapping of DNL. It even raises the question of whether the traditional 2D contour map is the best way to depict noise exposure when such 3D representations are possible.
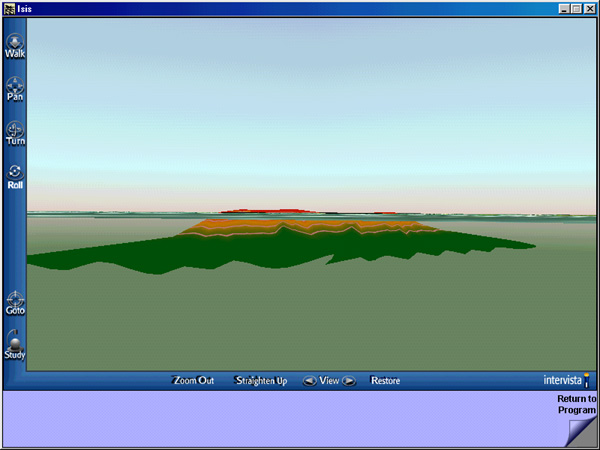 Figure 3
An animation like this can be constructed with a high level of precision. Noise prediction models can produce noise exposure estimates at selected points, and these can be organized into a map grid. The XYZ coordinates become the vertices of the 3D noise mountain. Color is applied by projecting a banded graphic image onto this from a side position. (3D Studio Max software is used to define the motion and the camera positions and to export these into the VRML format).
One particularly effective feature for community information programs has been the inclusion of a pointer that can be moved over a high resolution aerial photo. The noise exposure level at the pointer position is calculated and displayed. It is possible to zoom into the map and point to individual houses and buildings. An interactive system like this directly answers the critical question, "What is it going to be like at my house?". (We use the same XYZ grid to make the calculations. The triangulation technique being used is the one used by a standard contour plotting program, NMplot. This makes for a consistency of values between the conventional maps used to illustrate DNL and our interactive pointer version.)
SONIC BOOMS
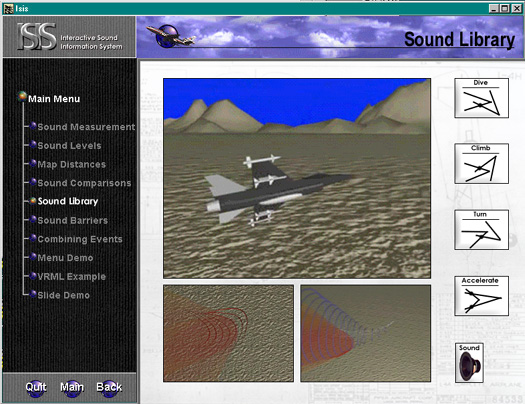 Figure 4
Figure 4 illustrates one of several screens explaining how sonic booms are created and how they focus. There are three animations for each of the maneuvers listed on the right. One frame shows an animation of the aircraft flying the selected maneuver. A second shows the animation in plan view showing the boom footprints. The last shows the plane and the footprints in perspective. Clicking on any of the illustrations will project it into the larger frame.
The major attraction of this sequence is that it effectively shows how the energy of sonic booms can focus at certain points on the ground. When a plane that is flying faster than the speed of sound makes a turn, the shockwaves created at each point along the turn continue to radiate forward. The result is a path of points where shockwaves overlap and an intense focused boom is created along the path of the intersections This phenomena is quite difficult to explain in words or in static diagrams but the displays express the concept in a quick and accurate fashion.
VIRTUAL REALITY RUNWAYS
One of the most common problems facing planners is explaining the consequences of actions not yet taken. The standard strategy is to develop, describe and evaluate alternatives. Computer scene simulations have become a common tool for evaluating the visual effects of projects. An analogous strategy works in the acoustic realm. Simulations can be used to interpret the impact of such things as building a sound wall or constructing new noise sources such as an additional airport runway.
We developed a community information program for the Port of Jacksonville that described the acoustic consequences of extending a runway at Craig Airport (Figure 5). The presentation describes the impacts from the viewpoint of the neighborhoods surrounding the airport. This program element is built using VRML components.
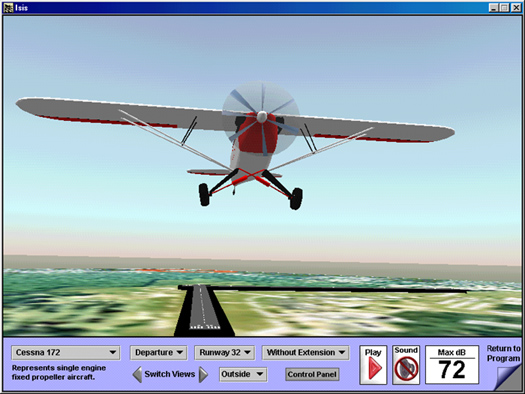 Figure 5
By making selections from menus and buttons that appear along the base of the screen, it is possible to choose aircraft type, select between departure or arrival operations, choose a neighborhood location (by runway end), and add or delete the runway extension. Based on the combination of selections, an animation is produced that shows the appropriate flyover accompanied by sounds that are calibrated to match what would be heard at the selected listener position. Additionally, the sound of the overflight can be heard from either an indoor our outdoor location.
The, "where am I?" question is answered through a change of camera position. At any time during an animation it is possible to pan the scene-from a viewpoint looking upward from the ground-to a side angle view taken above ground level-to a straight down top view. The base map graphic is clearly marked to show the listener positions at the end of each runway. Changing the viewpoint doesn't stop the animation and the plane can be seen flying over the listener's location in side or top views.
The sound levels that accompany the animations have been precalculated and the sounds are from digital recordings made at distances similar to those being illustrated. The software alters the amplitude of the digital file to suit the situation. Given that the 3D scenes are represented as VRML text files, the mix and match of locations, runways, operations, and aircraft can be accomplished through dynamic editing of the file. In other words, a very substantial collection of acoustic and visual experiences can be produced from a limited set of components.
EXPERIENCES USING THE ISIS SYSTEM
By using a system such as ISIS interactively and testing a variety of noise control strategies, a group without specialized technical training can quickly develop a respectable understanding of a complex, multidimensional noise management problem. It is instructive to consider how different groups have responded to presentations using the ISIS system. Interestingly, non-expert groups appear to have virtually no problem in adapting to a presentation system such as ISIS and, quite quickly grasp the significance of its interactive framework and begin asking the "what if" questions. After all, they see such things done routinely in TV shows and it does not seem unusual to them to have a system set up that has a computer producing sound samples and 3D scenes to order. The system is particularly attractive in decision settings where the normal mode of behavior is to make decisions at the time evidence is presented. In one situation, the town planning commissioners listened to simulated noise heard across property lines and, working interactively with the system, setting local noise regulations based on this experience.
By contrast, the noise specialists don't always see the utility of a system that demonstrates things they think should be obvious. They feel they do a quite adequate job of presenting noise information. Cost is also a consideration since the resources required for such presentations would diminish the funds that could be spent in additional technical studies. There is also a division of opinion among public relations specialists as to whether it is appropriate to spotlight noise issues in discussions with communities. This point of view is shared by many commercial airport operators and by commanders of many military installations. They feel the emphasis should be on the economic benefits of airports or national security considerations.
A noise information system such as ISIS may not be for everyone or a remedy for every noise management problem. However, the system works very well in situations where there are benefits from increased understanding of environmental noise issues. Most ISIS clients have been organizations with a well-defined noise problem-and the system is at its best in presenting comparative noise reduction strategies.
CONCLUDING COMMENT
It is important to consider what is authentically novel about an interactive demonstration system like ISIS. The use of graphics to represent imaginary things has been a staple part of artistic expression since the era of cave paintings. With the advent of movies, the visions were animated. Today, computer renderings are a staple of video games and special effects. What has happened is that technologies that were once expensive and esoteric have become more broadly accessible.
This impacts the work of city planners in several ways. As illustrated by software applications such as the one described here, local planning issues can be addressed using new media technologies. The creative use of 3D visualizations makes it possible to simplify discussions concerning complex noise propagation issues and make them more understandable. Program features dealing with DNL contours and sonic booms, are based on such illustrative technology.
However, there is more to this than interesting images and animations. When a technology becomes more accessible and transparent it changes the ways the technology is used and, more importantly, who can use it. Community noise analysis has been a domain of technical specialists but, as the technology becomes more accessible, community groups can crosscheck the work. There is power attached to control of information and broadening access to information can alter the political and institutional landscape.
Going a step farther, the visualizations sometimes spotlight flaws in the technical studies that are not evident when the results are presented in more conventional ways. The eye is drawn to patterns and anomalies. For example, the 3D representation of the noise accumulation along an airport runway shows as a sawtooth ridge (Figure 6).
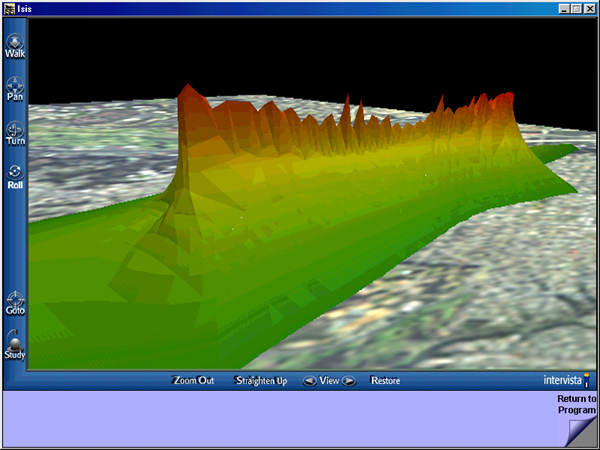 Figure 6
This is an artifact caused by having the runway out of alignment with
the grid of sample points used for the noise computations. The oddity isn't
visible in the 2D plots of the noise contours that were printed in this
project's environmental studies. But, the irregularities of the ridge line
affected the accuracy of the noise forecasts. The contour plotting software
is programmed to give the greatest computational attention to locations
where there is the most variation in noise exposure levels. The busywork
of tracing the fictitious crags above the runway bled computational energy
and reduced the quality of the mapping out in the community, away from
the airport, where it counts the most. Technicians may not only find their
work being more closely inspected by community groups-they may find it
being replicated, dissected, and persuasively challenged.
Copyright 2000 By Author
David T. Dubbink
David Dubbink Associates
Dr. Dubbink is a professor at California Polytechnic State University, San Luis Obispo and director of David Dubbink Associates. He holds a master's degree in city planning from UC Berkeley and a doctorate in environmental management from UCLA. He has served as agency administrator and planner for state and local agencies including the California Coastal Commission and the state's Tahoe Regional Planning Agency. Consulting projects in sound simulation include work for the US Air Force, Army, Navy, and Marine Corps, the Federal Aviation Administration, Transport Canada, the National Environmental office of Germany and work with public agencies and consulting firms in the US and abroad.
Contact: Dr. David Dubbink at David Dubbink Associates, 864 Osos Street,
Suite D, San Luis Obispo, CA 93401. Telephone: (805) 541-5325, Fax: (805)
541-5326, Email: dubbink@noisemangement.org.